


In this article, we explain what the Databricks AI/BI Dashboard is, who it’s designed for, when it makes sense to use it, and in which cases it might be better to choose tools like Power BI or Tableau.
With the addition of artificial intelligence and improvements to its interface, Databricks launched the AI/BI tool, which is divided into two components: AI/BI Dashboard and AI/BI Genie. In this article, we’ll focus on the AI/BI Dashboard.
What is AI/BI Dashboard?
AI/BI Dashboard is the native data visualization tool integrated into Databricks. It’s an evolution of the traditional dashboards, featuring a more intuitive interface, support for filters, and a much more visual, user-friendly approach.
The original dashboards provided fairly basic visualizations. While they could generate charts based on queries, they didn’t allow, for example, cross-filtering between charts or offer any sort of assistant to guide the development process.
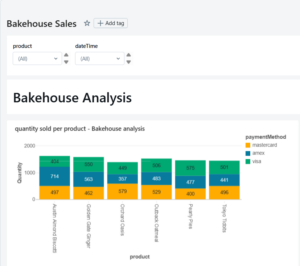
View of the legacy Databricks dashboard
The major leap this tool took was the integration of artificial intelligence into the reporting process. AI/BI Dashboard includes an assistant that supports users throughout the entire dashboard-building experience. It reflects the shift in modern development—where the focus is no longer on how to build something, but rather on enabling deeper, more meaningful, and complex analysis.
AI is introduced through an assistant that explains and corrects queries when they’re incorrect. And if you’re unsure how to visualize something, you can simply describe what you want to see in natural language, and the assistant will generate a chart based on your request.
Who is AI/BI Dashboard recommended for?
AI/BI Dashboard is designed for users who are familiar with SQL, the Databricks environment, and concepts such as catalogs, schemas, views, and tables.
The tool is aimed at data engineers, data scientists, and data analysts. It can also be used by certain business users who need to validate specific details or run targeted checks.
However, it is not recommended for users who are fully business-focused and rely on reports to drive strategic decision-making. In those cases, more traditional visualization tools like Power BI or Tableau are a better fit.
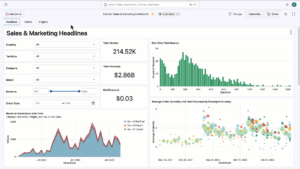
View of the Databricks AI/BI Dashboard
When to Use AI/BI and When to Choose Other Data Visualization Tools
The decision to use the AI/BI Dashboard instead of another data visualization tool depends on how you plan to use your dashboards.
AI/BI Dashboard is designed as a complementary tool—a support for the day-to-day tasks of those already working within Databricks. Its main purpose is not to deliver polished reports to end users, but to provide a quick way to verify data, detect anomalies, or check data quality without ever leaving the Databricks environment.
For example:
- A data engineer → Can quickly validate the status of the data using AI/BI.
- A data analyst → Can respond to business questions more efficiently and in less time.
- A junior analyst (with limited SQL knowledge) → Can leverage the AI/BI assistant to build queries faster and then visualize the results.
To better illustrate this, let’s imagine you need a coffee maker for two different situations:
Scenario 1: Someone works from home and needs a good cup of coffee to start the day. They’re short on time and not very demanding—they just need the coffee.
Scenario 2: Someone runs a specialty coffee shop with high demand and discerning customers. They need a machine that can meet those expectations.
In both cases, the coffee itself is the same. But should we use the same machine in both scenarios? The answer is no. The right choice depends on the context, the intended use, and the experience you want to deliver.
In the first scenario—given the practicality and cost—a moka pot or a cloth filter would be ideal (in data terms, that’s the AI/BI Dashboard: a simpler tool that gets the job done). In the second scenario, where a more refined experience is required, the best choice would likely be a commercial-grade machine that allows for greater customization.
Translated into the world of data, this means choosing a more advanced visualization tool—like Power BI or Tableau—that offers deeper functionality (such as hierarchy navigation, detailed drill-downs, customized tooltips, and more).
The data is the coffee, the tools are the machines, and the key is understanding the purpose of each.
How to Use AI/BI Dashboard?
For those who are not yet familiar with the tool, this video provides a step-by-step tutorial showing how to use it:
Conclusions
AI/BI Dashboard is designed to be fast, functional, and easy to use—especially for those already working within the Databricks environment. It’s not intended to compete with advanced visualization tools like Power BI or Tableau, but rather to complement them.
It serves as a support tool, and when used effectively, it can be incredibly powerful for validating, exploring, and sharing information among technical teams.
It’s important to understand that there are no universally “better” or “worse” tools—only tools that are more or less appropriate depending on the goal and context.
In that sense, AI/BI Dashboard is a strong option for specific scenarios—particularly those in which the end users are technical professionals who need visual support for their tasks within Databricks.
When choosing a data visualization tool, what really matters is understanding when, how, and why to use it. Before making a choice, ask yourself: What do we need it for? Who will be using it? And what kind of experience do we want to deliver? Once those answers are clear, the right choice almost always becomes obvious. 😉